Permission:  Group Admin, Group Operator
Objective
| Access Admin Console by clicking |
On the Data Intelligence tab, you may review details on your user activity and Content.
- User Activity
- Content
- Total Color Composition Rate
- Trends Chart
- Scatter Chart
- Leadtime
- Cost Saving
Details
| Menu | Sub-Menu | Details |
| Data Intelligence |
| View usage statistics per user, including content views and rendering usage. In addition, view Color analytics of your Contents. Leadtime and Cost Saving analysis shows the workflow efficiency and potential sample cost savings |
1) User Activity
- Filter the time period to view
- Filter the type of users to view
- Active users are anyone with more at least 1 count of the measured values.
- Inactive users are those who did not use any of the counted values.
- Search specific users with their registered name or email to view their usage
- Name and Email of the user. Users who have been deleted from the Group and no longer have permission will be greyed out.
- Click on the field to sort - either in ascending or descending order
Click the Content Download History button to view the list of downloaded content or export it as an Excel file.
- Click the Detail button to view the download history for each user.
- Information : Email, User Type, Last Signed in, Content Page view, Content Creation, Content Download, Content Deletion, Comments, Annotations, Rendering Usage
2) Content
- Filter the Date & Workroom you want to view
- For Group Operators, the 'Space' filter will only display the list of Spaces to which they have Viewer or above permission to. Group Admin can select any Space within the Group.
- Total Style Contents: Total number of Contents uploaded during the date range, and included in the statistics shown below. This covers ONLY the Contents you have viewing permission to.
- Average Used Colors: Average number of Colors used per Style Content
- Total Fabric Colors: Total number of Fabric Color used within the selected Space
*ONLY Applicable to any Content uploaded on March, 2023 and onward.
1. Total Color Composition Rate
The Doughnut Chart on the left shows the distribution of Primary Colors used for the Style Contents. Hover over the Color to view the details.
On the right hand table, click on each Primary Color to view all the related Original Colors.
- Primary Color: Main Color(Hex/Pantone) with the highest usage rate among similar color group
- Original Color: All unique Colors used. Grouped by Primary Color.
*Color usage rate is calculated based on the fabric size
2. Trends Chart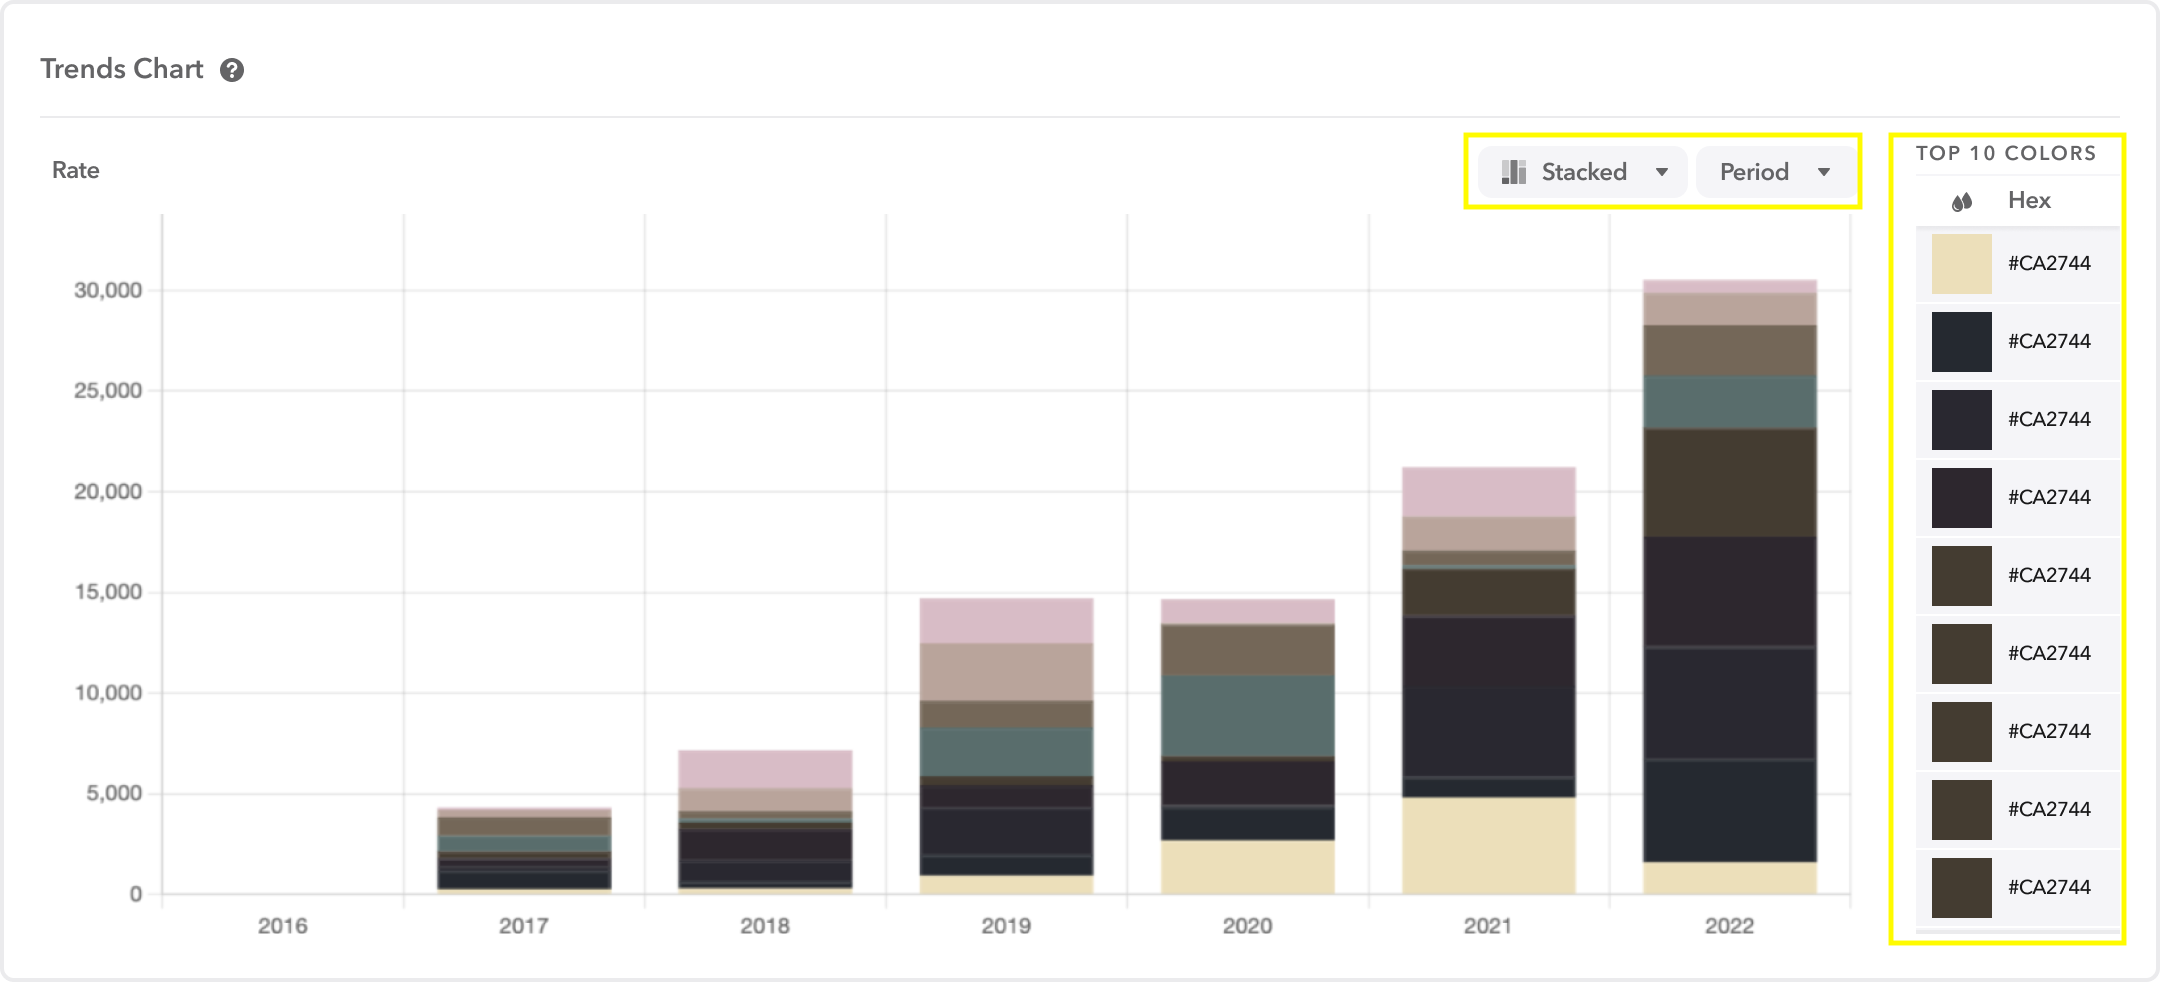
Trends Chart shows the number of Style Content that used the top 10 Primary Colors over time. You may view the Color Trend chronically.
Change the chart type to Bar or Line, or change period to Week or Year to change the view.
Bar Chart | Line Chart |
3. Scatter Chart
Scatter Chart visualizes the Saturation/Brightness of the Colors used. Click on the Primary Color to view the Original Colors included in the group.
- X-axis: Hue (Color Spectrum of 0~360)
- Y-axis: Saturation or Brightness per your selection. Click on the upper left dropdown button to switch the view.
- Marker Size: Number of Style Contents that used the selected Color.
3) Leadtime
Leadtime Analysis shows the workflow efficiency with a clear summary of lead times, completion trends, and the current status of all contents in their Workroom.
- Summary : Displays the total content and overall lead time at the top.
- Total Style Content : The total amount of style content in the space (or selected space)
- Average Leadtime : Displays the average time it takes for content to move through each workflow step, based on the applied filters.
- Average Spent time : Displays the average time spent at each workflow step for the filtered contents in a Space.
- Style List : Lists the current lead times for all Style contents in the Workroom.
- Export : Lead time analysis data on the screen can be exported to PDF.
Visit Leadtime menu of Data Intelligence, select the 'space' and 'category' to see the analysis.
* The Space option is only visible when a user with admin permission accesses the Admin Console.
* The analysis data is updated and displayed based on the previous day.
Items uploaded after April 2025 with no workflow status changes may be excluded from the list.
4) Cost Saving
Cost Saving Analysis shows the potential sample cost savings across all Style contents in Workrooms. The savings are calculated based on the number of versions and colorways per style, multiplied by a sampling cost defined by the user.
- Summary : Displays the total styles, colorways, default sample cost and total saving cost at the top.
- Total Style : Total number of contents with ‘Style’ content type.
- Total Colorway : Total number of digital sample versions created across styles.
- Default Sample Cost : Default sampling cost to estimate the total saving cost.
- Total Saving Cost : Sum of estimated savings across all styles, calculated by: Total Colorways × Sampling Cost (per style)
- Colorways per workflow : Displays the total number of colorways at each workflow status.
- Sample Saving Cost per Content : Displays Each style’s saving is calculated as: colrway x Sampling Cost (per style)
- Export : Cost saving analysis data on the screen can be exported to PDF.
Visit Cost Saving Analysis menu of Data Intelligence, select the 'space' , 'category' and 'workflow' to see the cost analysis.
* The Space option is only visible when a user with admin permission accesses the Admin Console.
* The analysis data is updated and displayed based on the previous day.
Items uploaded after April 2025 with no workflow status changes may be excluded from the list.